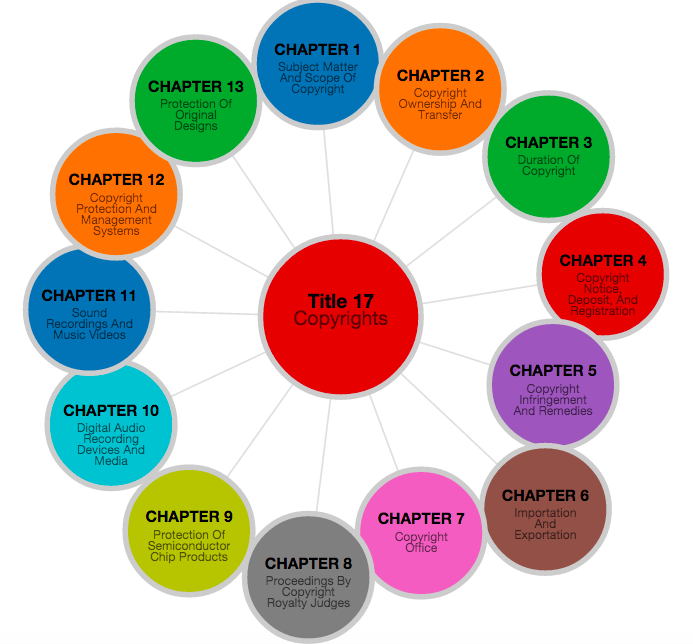
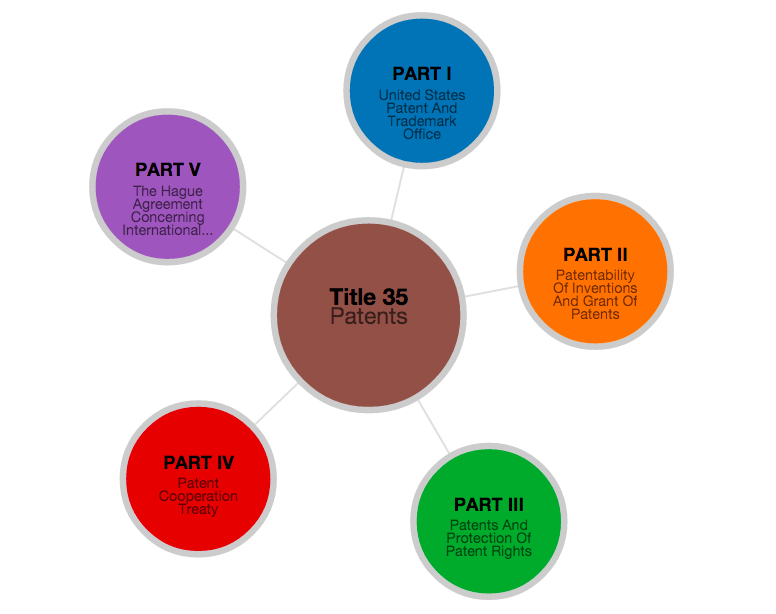
I have created a new experimental app for visualizing and exploring U.S. Law using a force-directed graph. You can click on the picture above to launch it. This force-directed visualization is more intended to be visually interesting rather than a full-fledged U.S. law navigation tool.
This is the second in a series of data visualizations of US Federal Law that I am creating using the d3 data visualization framework and javascript. The first data visualization is located here.
Explore the Copyright Code or the Patent Code
This app allows you to explore two titles of the US Code.
Title 17 – The Copyright Code
Title 35 – The Patent Code
Hub and Spoke Representation of US Code Hierarchy
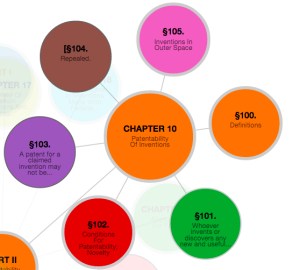
The chart uses a “hub and spoke” layout to represent the hierarchy of a given Title of the U.S. Code such as Title 35. The center circle represents a “parent” portion of the code – a portion with sub-portions under it (e.g. Chapter 10) and the surrounding circles on the edge represent the “children” portions that belong to that parent (Section 100, Section 101, section 103..).
You can click on an outer circle to open up the “children” parts that reside under that circle. If a circle has “children” parts, the circle border will be a thick grey. The selected circle will then be the new “parent”, and its “children” portions will be displayed.
Force Directed Graph
The app uses a “force directed graph” engine to display the titles of the U.S. Code. Force directed graphs are often used to model interactions between physical objects, such as molecules reacting to gravity. Because force directed graphs such as this simulate physical forces such as gravity, using this framework to display data means that various parts can tend to move around somewhat randomly.
Continue reading


